Using smartphones and wearable devices to monitor behavioural changes during COVID-19
First online: 29-04-2020 | Last update: 07-06-2020
Authors
Shaoxiong Sun, Amos A Folarin, Yatharth Ranjan, Zulqarnain Rashid, Pauline Conde, Callum Stewart, Nicholas Cummins, Faith Matcham, Gloria Dalla Costa, Letizia Leocani, Per Soelberg Sørensen, Mathias Buron, Ana Isabel Guerrero, Ana Zabalza, Brenda WJH Penninx, Femke Lamers, Sara Siddi, Josep Maria Haro, Inez Myin-Germeys, Aki Rintala, Vaibhav A Narayan, Giancarlo Comi, Matthew Hotopf, Richard JB Dobson and on behalf of the RADAR-CNS consortium
The Department of Biostatistics and Health informatics, Institute of Psychiatry, Psychology and Neuroscience, King’s College London, London, UK (S Sun PhD, A A Folarin PhD, Y Ranjan MSc, Z Rashid PhD, P Conde BSc, C Stewart MSc, Prof R JB Dobson PhD)
Institute of Health Informatics, University College London, London, UK (A A Folarin PhD, Prof R JB Dobson PhD) Chair of Embedded Intelligence for Health Care & Wellbeing, University of Augsburg, Germany (N Cummins PhD)
The Department of Psychological Medicine, Institute of Psychiatry, Psychology and Neuroscience, King’s College London, London, UK (F Matcham PhD, Prof M Hotopf PhD)
University Vita Salute San Raffaele, Neurorehabilitation Unit and Institute of Experimental Neurology, IRCCS Ospedale San Raffaele, Milan, Italy (G Dalla Costa MD, Prof L Leocani MD)
Danish Multiple Sclerosis Centre, Department of Neurology, Copenhagen University Hospital Rigshospitalet, Copenhagen, Denmark (Prof P S Sørensen MD, M Buron MD)
Multiple Sclerosis Centre of Catalonia (Cemcat), Department of Neurology/Neuroimmunology, Hospital Universitari Vall d’Hebron, Universitat Autònoma de Barcelona, Barcelona, Spain (A I Guerrero MSc, A Zabalza MD)
Department of Psychiatry, Amsterdam UMC, Vrije Universiteit and GGZinGeest, Amsterdam, The Netherlands (Prof B WJH Penninx PhD, F Lamers PhD)
Parc Sanitari Sant Joan de Déu, CIBERSAM, Universitat de Barcelona, Sant Boi de Llobregat, Barcelona, Spain (S Siddi PhD, Prof J M Haro MD)
Centre for Contextual Psychiatry, Department of Neurosciences, KU Leuven, Leuven, Belgium (Prof I Myin- Germeys PhD, A Rintala MSc)
Janssen Research and Development LLC, Titusville, NJ, USA (V A Narayan PhD)
Institute of Experimental Neurology, IRCCS Ospedale San Raffaele, Milan, Italy (Prof G Comi MD)
South London and Maudsley NHS Foundation Trust, London, UK (Prof M Hotopf PhD)
www.radar-cns.org (RADAR-CNS consortium)
Corresponding author
Shaoxiong Sun
Email: shaoxiong.sun@kcl.ac.uk
Telephone: +44 (0)20 7848 0951 SGDP Centre, IoPPN
King’s College London
Box PO 80
De Crespigny Park, Denmark Hill London
SE5 8AF
Citation
Sun, Shaoxiong, et al. “Using smartphones and wearable devices to monitor behavioural changes during COVID-19.” arXiv:2004.14331. https://arxiv.org/abs/2004.14331
Summary
Background In the absence of a vaccine or effective treatment for COVID-19, countries have adopted Non-Pharmaceutical Interventions (NPIs) such as social distancing and full lockdown. An objective and quantitative means of monitoring the impact and response of these interventions at a local level is urgently required. Here we explore the utility of the recently developed open-source mobile health platform RADAR-base as a toolbox to test the effect and response to NPIs aimed at limiting the spread of COVID-19.
Methods We included 1062 participants recruited in Italy, Spain, Denmark, the UK, and the Netherlands. We derived features from the phone and wearable device for length of time spent at home, distance travelled from home, heart rate, sleep, and patterns of phone use. We visualised data using time series plots and performed statistical tests to assess differences in behaviour during baseline, pre-, and post-lockdown periods.
Findings We found significant changes in behaviours between baseline/pre-lockdown and post-lockdown for all features except total sleep duration. In general, participants spent more time at home, travelled much less, and were more active on their phones, interacting with others by using social apps. Nevertheless, the response across nations differed with Denmark showing attenuated changes in behaviour.
Interpretation Differences in the extracted features by country may reflect variations in communication and implementation of different NPIs as well as cultural differences. We have demonstrated that generalised open-source mobile health monitoring platforms such as RADAR-base which leverages data from wearables and mobile technologies are valuable tools for helping understand the behavioural impact of public health interventions implemented in response to infectious outbreaks such as COVID-19.
Funding EU/EFPIA IMI Joint Undertaking 2 (RADAR-CNS grant No 115902)
1. Introduction
On 11 March 2020, the World Health Organisation (WHO) declared the rapidly spreading SARS-CoV-2 virus outbreak a pandemic. This novel coronavirus is the cause of a contagious acute respiratory disease (COVID-19), which was first reported in Wuhan, Hubei Province, China.1–3 As of 17 April 2020, it had infected over two million people and spread to 210 countries and territories around the world. While precise statistics on mortality are being determined, COVID-19 can be deadly with an estimated 1% case fatality rate, and this rate increases dramatically for the elderly and vulnerable who have underlying health problems.4,5 The outbreak of COVID-19 has placed an unprecedented burden on healthcare systems in most-affected countries and has resulted in considerable economic losses and possible deep global recession.6,7
To date, there is no vaccine or effective treatment. The widely adopted strategy has been the use of Non-Pharmaceutical Interventions (NPIs) such as social distancing and even full lockdown in order to control the spread of the virus and ease pressure on health and care systems.8,9 NPIs have been implemented in many countries including China, Italy, Spain, the United Kingdom (UK), and the Netherlands. These measures have been shown to considerably reduce the new confirmed cases in China and South Korea, among others.8 Key to the success of NPIs is the timing of these interventions and the response of the population, both of which might differ among countries, and could necessitate further interventions in the case of low compliance either nationally or locally. Therefore, we urgently require an objective and quantitative way to monitor population behaviour to assess the impact and response of such interventions. Additionally, we need to monitor for the potential effects of a rebound in cases in the winter months as social distancing measures are relaxed in order to strategise and understand where course corrections are required. Similarly, understanding potential seasonal forcing of COVID-19 will require a good understanding of the effects of different NPIs so they can be factored out.
The increasing availability of wide-bandwidth mobile networks, smartphones, and wearable sensors makes it possible to collect near-real-time high-resolution datasets from large numbers of participants and greatly facilitates remote monitoring of behaviour.10–12 By leveraging sensor modalities in smartphones which includes Global Positioning System (GPS) tracking, and Fitbit devices which includes step counts and heart rate, it is possible to access mobility and even wellness for the population. To manage the data collected in multiple sensor modalities and mobile devices, platforms such as the open-source RADAR-base (radar- base.org) mobile health platform have been developed.13 This platform has been used to enable remote monitoring in a range of use cases including central nervous system diseases (major depressive disorder (MDD), epilepsy and multiple sclerosis (MS)) as part of the IMI2 RADAR-CNS major programme (radar-cns.org).14
In this paper, we explore the utility of the RADAR-base platform as a toolbox to test the effect and impact of NPIs aimed at limiting the spread of infectious diseases such as COVID-19. Specifically, we investigate parameters derived from smartphones including GPS and phone usage, and from wearable Fitbit devices including step counts, heart rate, and sleep patterns, which may be altered by changes in lifestyle due to NPIs such as social isolation.
2. Methods
We leveraged participant data already collected from November 2017 onwards as part of the ongoing RADAR-CNS studies.13–15 The RADAR-CNS studies were approved by all local ethics committees and all participants signed informed consent.15 We included 1062 participants recruited in five European countries: Italy, Spain, Denmark, the UK, and the Netherlands. The data have been collected for the purpose of finding new ways of monitoring MDD (Spain (150), the Netherlands (103) and the UK (316)) and MS (Milan, Italy (208); Barcelona, Spain (179); and Copenhagen, Denmark (106)) using wearable devices and smartphone technology to improve patients’ Quality of Life (QOL), and potentially to change the treatment of these and other chronic disorders. As we focused on country-level behavioural changes in response to the NPIs, we aggregated data collected in Spain and did not focus on analysing differences between participants with MDD and MS (except for a sensitivity analysis described in the Discussion). Passive participant data were collected through a smartphone and a Fitbit device, which included location, activity, sleep, heart rate and phone usage data. These passive data required minimal conscious participant engagement and were collected continuously on a 24/7 basis. In addition to passive data, active data were collected, which required clinicians or participants to fill out forms or questionnaires or perform short clinical tests (e.g. speech, walking, balance tests). All data were managed by the RADAR-base platform.
To study physical-behavioural changes in response to COVID-19 NPIs, we examined participants’ mobility by analysing relative GPS data from smartphones and step count data from Fitbit devices. We investigated phone unlock duration and social app duration to study social-behavioural changes. Functional measures such as sleep and heart rate from Fitbit devices were also analysed to identify possible changes as a result of social distancing.
The smartphone-derived GPS data were sampled at a frequency of five minutes by default, with lower frequency dependent on network connectivity. Spurious GPS coordinates were identified and removed if they differed from preceding and following coordinates by more than five degrees. Home location was determined daily by clustering GPS data between 8 pm and 4 am with the mean coordinate of the largest cluster being used. The clustering was implemented using Density-Based Spatial Clustering of Applications with Noise.16 A duration gated by two adjacent coordinates was regarded as a valid homestay duration on the condition that both coordinates were no further than 200 meters from the home location. A duration longer than one hour was excluded due to the large proportion of missing data when compared to the five-minute sampling frequency. All valid home stay durations between 8 am and 11 pm were summed to calculate daily homestay. Daily maximum distance from home was also computed based on the coordinates in the same period.
In addition to mobility features extracted from smartphones, intraday time series for step count was taken from the Fitbit device. Likewise, daily sleep duration was computed as the summation of all of the four Fitbit-output stages (AWAKE, LIGHT, DEEP, REM) sampled every 30 seconds. Finally, daily mean heart rate was calculated by averaging the Fitbit-output heart rate readings, sampled every five seconds.
To explore changes in phone usage, daily unlock duration was calculated by summing time intervals starting with the unlocked state and ending with the standby state. Single intervals longer than four hours were excluded, which might result from a missing standby state or unintentionally leaving the phone unlocked. App usage was quantified by classifying apps according to categories listed on Google Play. As we were particularly interested in cyber social interactions at the time of social distancing, we focused on the daily use time of social apps such as Facebook, Instagram, and WhatsApp.
We visualised data using time series plots. The participant daily average and standard deviation of each feature were calculated and then plotted. A minimum of 20 participants’ data points was a prerequisite for calculation for any given day in order to reduce variance and noise. The calculation was implemented after excluding zeros and then excluding values below 10% or above 90% on each day. This filtering step helped to mitigate the influence of daily outliers caused, for example, by missing data. To facilitate interpretation, we also marked time points of public announcements related to lockdown policies.17
To examine physical- and social-behavioural changes induced by the lockdowns, comparisons among baseline, pre-, and post-lockdown were carried out using Kruskal-Wallis Tests, where the filtered daily average of features for 20 consecutive days were used for each of the three groups.18 For the baseline phase, we chose either a 20-day period around one year before the lockdowns, or the earliest stable 20-day period. For the pre-lockdown phase, we chose the period immediately before the first restrictive measure. For the post-lockdown phase, we chose the period following the most recent lockdown. If a significant difference among these three groups was found, post-hoc Dunn test was applied with Bonferroni corrections.19 Boxplots were used to present the results. A p-value < 0·05, after correction, was deemed statistically significant. It should be noted that we only applied corrections resulting from multiple comparisons for a given feature and a given country.
3. Results
Time series plots from 1 February 2019 to 12 April 2019 and boxplots of features are shown in figure 1-5 and in figure 6 (a-g). Figure 7 shows zoom-in time series plots for figure 3 and 4. Most features (except total sleep duration) in baseline and pre-lockdown phases were significantly different from post-lockdown phases. In Italy, homestay duration started to increase when Lombardy went into lockdown and remained athigh levels during the national lockdown (z-test statistics = -6·3, p-value < 0·001). Similarly, maximum distance from home reduced to very low levels by the end of March (z-test statistics = 6·1, p-value < 0·001) and Fitbit step count (z-test statistics = 5·1, p-value < 0·001) and heart rate (z-test statistics = 6·2, p-value <0·001) decreased. We saw an increase in phone usage, as measured through unlock duration (z-test statistics = -5·4, p-value < 0·001) and social app duration (z-test statistics= – 3·7, p-value < 0·001). In Spain, after the lockdown was imposed, there was a sudden and marked increase in homestay duration (z-test statistics = -5·4, p-value < 0·001), reduction in maximum distance from home (z-test statistics = 4·5, p-value< 0·001), and reduction in Fitbit step count (z-test statistics = 4·4, p-value < 0·001), phone interaction (unlock duration (z-test statistics = -6·2, p-value < 0·001) and social app duration (z-test statistics = -4·3, p<0·001)). In Denmark, the changes in homestay duration (z-test statistics = -5·4, p-value < 0·001) and Fitbit step count (z-test statistics = 2·7, p-value < 0·05) were less evident when restrictions were applied, but maximum distance from home dropped sharply (z-test statistics = 4·2, p-value < 0·001). In the UK, starting from one week before the national recommendation, we saw a dramatic increase in homestay duration (z-test statistics = -5·4, p-value < 0·001) and a sharp decrease in maximum distance from home (z-test statistics = 4·1, p-value < 0·001). Similar changes were observed in phone interaction (unlock duration (z-test statistics= -3·4, p-value < 0·01) and social app duration (z-test statistics = -3·0, p-value < 0·01)) and Fitbit step count (z-test statistics= 4·1, p-value < 0·001) as well. In the Netherlands, an increase in homestay duration (z-test statistics= -4·0, p-value < 0·001) and decrease in distance from home (z-test statistics = 4·6, p-value < 0·001) was observed, while the changes in Fitbit step count (z-test statistics = 3·8, p-value < 0·001), phone usage (unlock duration (z-test statistics = -3·0, p-value < 0·01) and social app duration (z-test statistics = -4·3, p-value < 0·001)) were less obvious compared toItaly, Spain and the UK. In Figure 7, we observed marked changes following two announcements in addition to national NPIs. In all the time series plots, we observed behavioural changes induced by country-specific NPIs and announcements.
4. Discussion
In this study, we investigated COVID-19 related changes in features derived from mobile devices (smartphones and wearable Fitbit devices) of participants recruited from five European countries to theRADAR-CNS programme. We studied how lockdown in response to the COVID-19 pandemic affected participant behaviour in terms of mobility, functional measures, and phone usage.
Our results demonstrate that, in all countries, the lockdown significantly altered lifestyles, albeit in different ways. Participants spent more time at home, travelled much less, and were more active on their phone, interacting with others by using social apps. However, the response across nations differed and may be related to the country-specific implementations of NPIs and perceived degree of risk at the national level. Participants in Spain put a hard stop on daily outdoor activity on the day of their national quarantine. In contrast, participants in Denmark maintained more of their usual daily routine. These findings are also in line with Google mobility reports.20–24 According to the reports updated on 11 April, Italy, Spain, and the UK saw no less than a 32% decrease for all mobility trends except residential stay, which witnessed over a 19%increase. On the contrary, Denmark and the Netherlands showed more than a 33% increase in mobility trends for parks, in addition to no more than an 11% increase in residential stays. Furthermore, mobility trends to Grocery and Pharmacy witnessed a 4% decrease in the Netherlands and a 4% increase in Denmark. The difference in the changes in the extracted features may reflect difference in communication and implementations of NPIs, population reactions to different coping strategies, and cultural differences.
In comparison to Google mobility reports which provide valuable aggregated data for short periods, RADAR-base is an open-source highly configurable platform that allows for collecting and analysing participant-level data in real-time with a potential for targeted interventions. In addition, RADAR-base also collects self-reported questionnaires related to emotional well- being, functional status, and disease symptom severity of its participants.15 In April 2020, new questionnaires are being distributed to specifically assess COVID-19 symptoms and diagnosis status of our research participants. Our future work will use the entirety of these data to gain additional insights such as digital early warning signs of COVID-19 and impact of COVID-19 on the QOL and clinical trajectory of their primary diagnosis (MDD or MS).
We speculate that the decrease in heart rate may be attributed to the increase in indoor stay and greater sedentary behaviour, and the slight increase in total sleep duration. This decrease, coupled with an increase in social app duration, could possibly serve as indicators of social distancing. Furthermore, it has been shown that an elevated resting heart rate may suggest acute infections.25 It would be interesting to infer one’s infection by continuously monitoring heart rate, especially when the population remains indoor for a vast majority of the time. Such monitoring provides the possibility to generate early warning signals for symptomatic or presymptomatic respiratory infections, thereby aiding timely self-isolation or treatment. The COVID-19 related questionnaires we are now distributing will allow us to gain a deeper understanding of the relationship between mobile devices derived features including heart rate/activity and the COVID-19 symptoms.
In addition to changes in trends, we also identified interesting findings that happened over very short periods (see figure 7). A dramatic change in unlock duration was observed in Denmark around 11 March 2020 which may be related to the announcement of the pending lockdown on that day and a 185% increase in the confirmed cases in Denmark on the previous day. Another example can be seen just after the mitigation phase was announced in the UK on 12 March, in which social distancing was not strongly recommended, some participants seemed to isolate themselves voluntarily by staying at home for much longer. This observation may also explain the significant difference between the baseline and pre- lockdown phases and suggests that people may have acted ahead of further government restriction. Furthermore, this is accompanied by a marked loss of weekday/weekend periodic structure pre/post lockdown period (see figure 7). Together these observations highlight the potential of remote monitoring to monitor population reactions to interventions.
There are some issues to consider in relation to this work. Firstly, we only used a limited duration of periods (20 days) to compare the behaviour across the three phases. This limitation was because lockdowns had only recently been imposed. However, even with these short periods, we were still able to detect significant differences among the three phases, highlighting the potential advantages of using mobile devices for detecting behaviour changes. Future work will focus on collecting and analysing more data as the project data collection is ongoing. Second, the participants included in this study have different medical conditions (depression or multiple sclerosis), which led to different baseline levels across countries. Nevertheless, as the focus of this study is the changes in the pre-, and post-lockdown phases relative to the baseline, we were still able to identify and compare the changes induced by lockdowns. We also analysed the data collected in Spain split into MDD and MS separately. The trends and the statistical differences in all features remained the same except total sleep duration. The unsplit case showed statistical significance (z-test statistics = -2·4, p = 0·047), while the split case did not. This was probably due to reduced sample size when split into MDD and MS. Understanding of any artefacts or effects introduced into the RADAR-CNS data by the NPIs will be crucial in RADAR-CNS being able to deliver its aim of identifying signals that predict and prevent MDD and MS. Third, on account of requirements for participants’ privacy in the RADAR-CNS studies, location data were purposely obfuscated with a participant-specific random value preventing precise localisation of the participants, which prevented us from taking into account geographic factors within a country. It would be interesting to examine how specific regions react to lockdowns when these data are available in future work. Fourth, limited sample sizes in certain countries and data loss impacted the smoothness of the time series plots. The time series plots for Denmark and the Netherlands showed relatively large variance particularly in the early phase as these sites have only recently begun recruiting. Several dips and spikes in step counts and heart rate were seen in all countries during July and August. This was due to the fact that we had some data loss due to connectivity issues with the Fitbit server during this time. Fifth, we only explored a subset of features that can be derived from smartphones and Fitbit wearable devices. Future work will investigate whether other features offer additional information for a more complete description of lifestyle changes. Finally, national policy and participant acceptability determine what value is placed on privacy and therefore, what level of monitoring is acceptable. At one end of the spectrum, we have seen individual-level contact tracing mobile apps and at the other privacy-preserving approaches that only allow population intervention monitoring. We were able to demonstrate value in the data collected even under strict privacy-preserving conditions.
5. Conclusions
Using individual-level data from smartphones and wearable devices over a one-year period covering the outbreak and subsequent spread of the COVID-19 pandemic across five European countries, we were able to detect and monitor the physical-behavioural and social- behavioural changes in response to the NPIs. We found that most participants spent more time at home, travelled much less and were more active on their phone, in particular, interacting with others using social apps. We also showed the different responses across countries with Denmark showing attenuated responses to NPIscompared to other countries. Furthermore, we were able to identify features such as homestay duration, maximum distance from home and step count which varied significantly as the implementation of NPIs. These features could be used as objective measures for evaluating aspects of NPIs performance during their introduction and any subsequent relaxation of these measures. This work demonstrates the value of a generalised open-source platform such as RADAR-base to leverage data from wearables and mobile technologies for understanding behavioural impact of public health interventions implemented in response to infectious outbreaks such as COVID-19. This ability to monitor response to interventions, in near real time, will be particularly important in understanding behaviour as social distancing measures are relaxed as part of an COVID-19 exit strategy. Future work will include utilising participants responses to COVID-19 related questionnaires, together with an expanded feature set to gain more specific understandings into the relationship between mobile devices derived features and the COVID-19 symptoms.
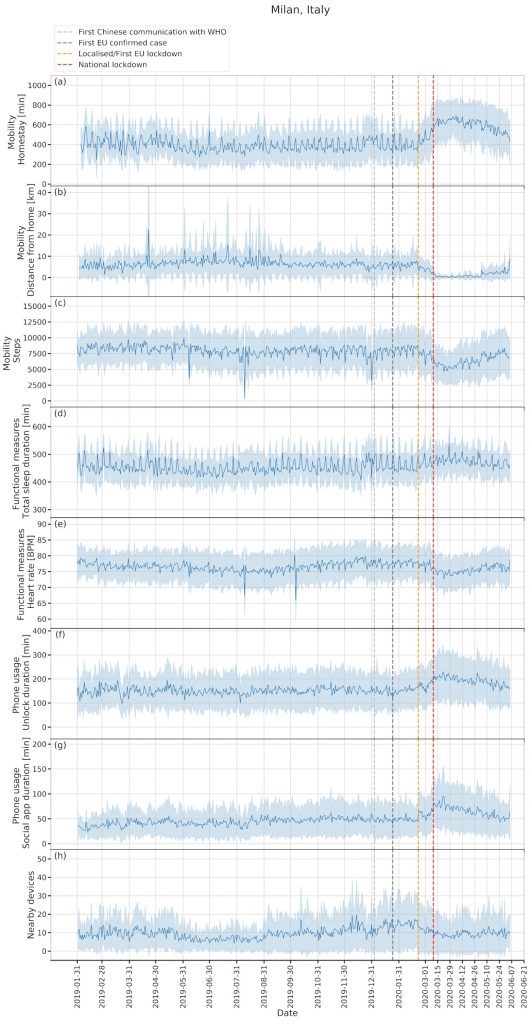
Figure 1. Time series plots for Milan, Italy (208 participants).
For the most recent updated figures, please visit here.
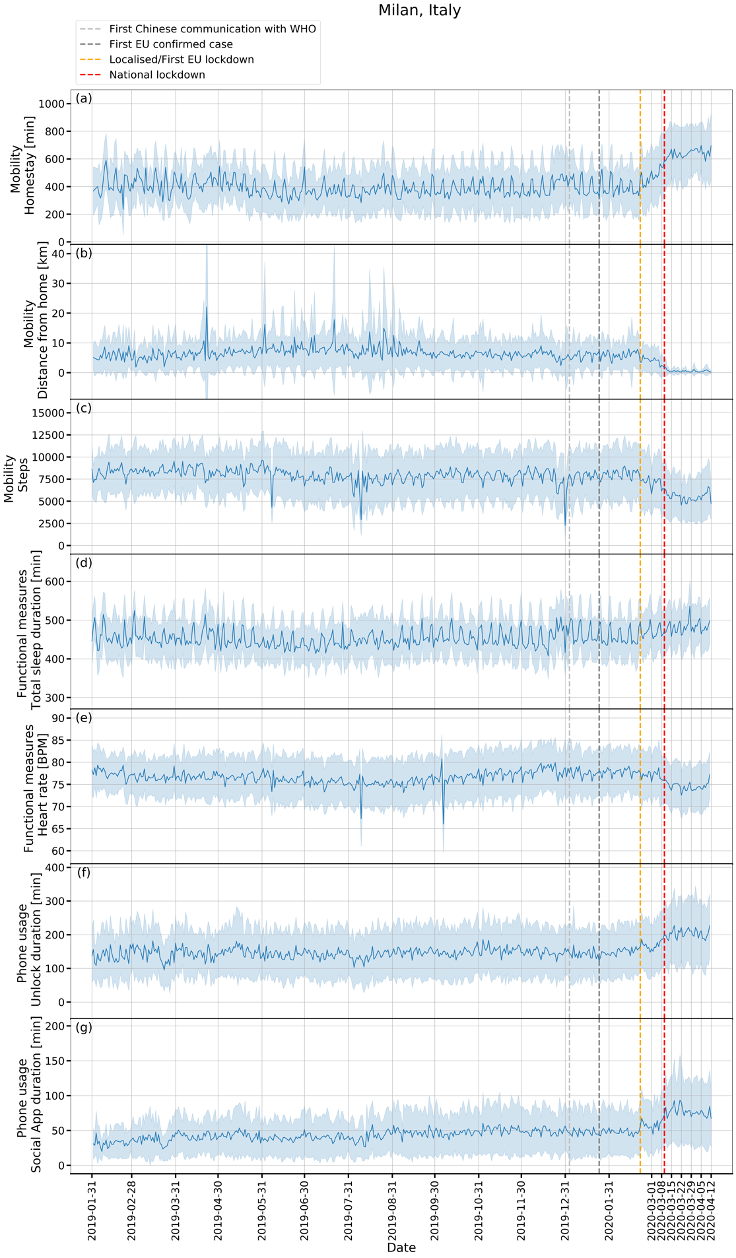
(a): homestay duration, (b): maximum distance from home, (c): Fitbit step count, (d): total sleep duration, (e): heart rate, (f): unlock duration, (g): social app duration. Solid line: mean, shade: mean ± standard deviation.
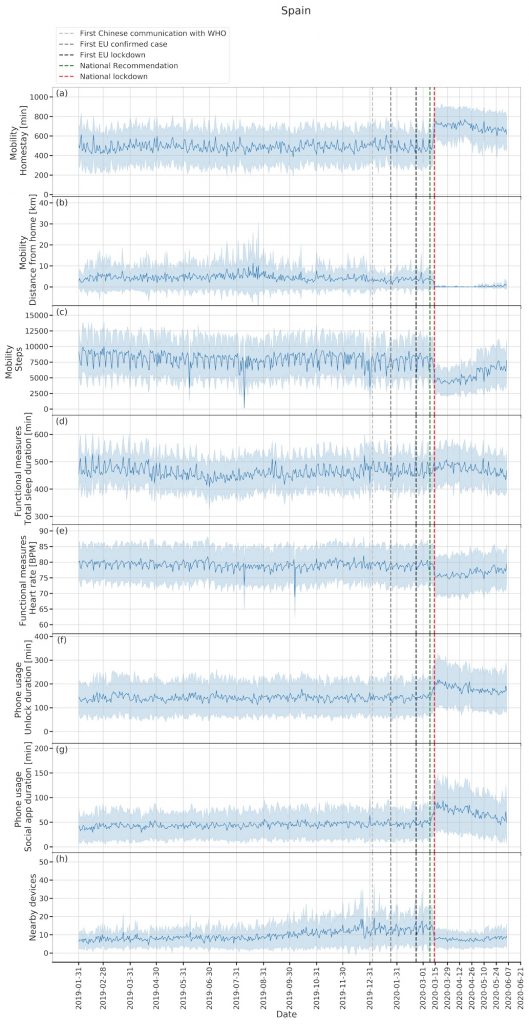
Figure 2. Time series plots for Spain (329 participants).
For the most recent updated figures, please visit here.
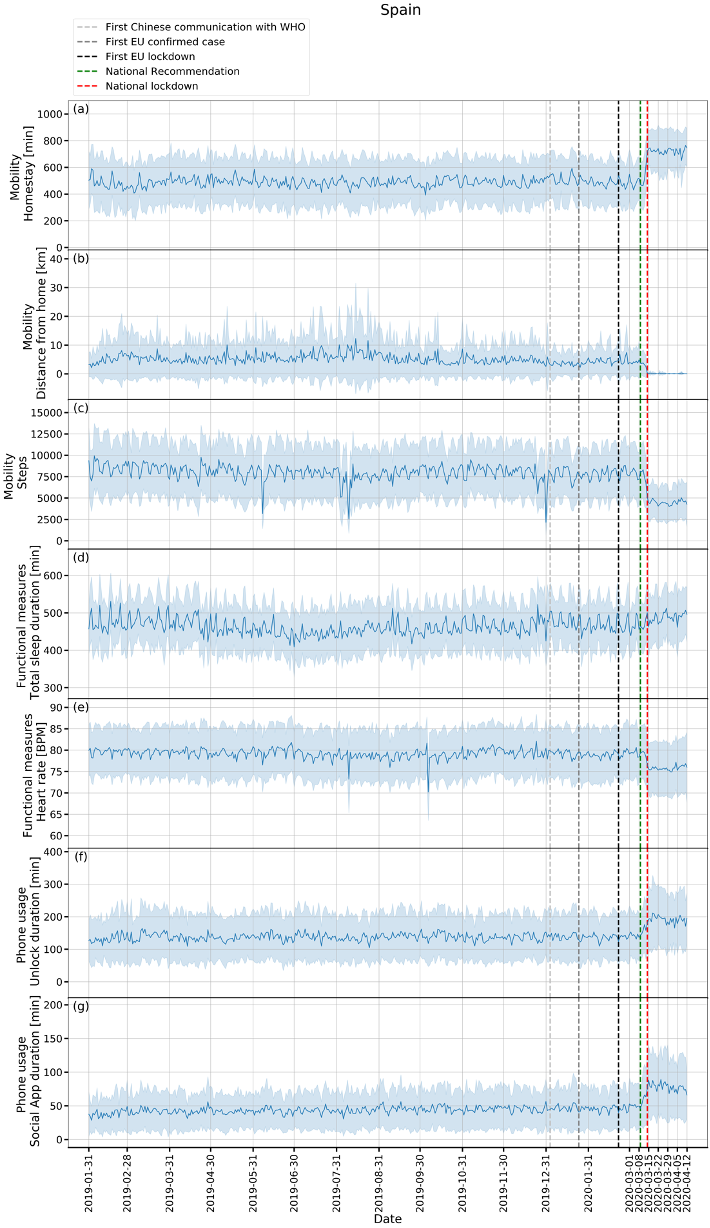
(a): homestay duration, (b): maximum distance from home, (c): Fitbit step count, (d): total sleep duration, (e): heart rate, (f): unlock duration, (g): social app duration. Solid line: mean, shade: mean ± standard deviation.
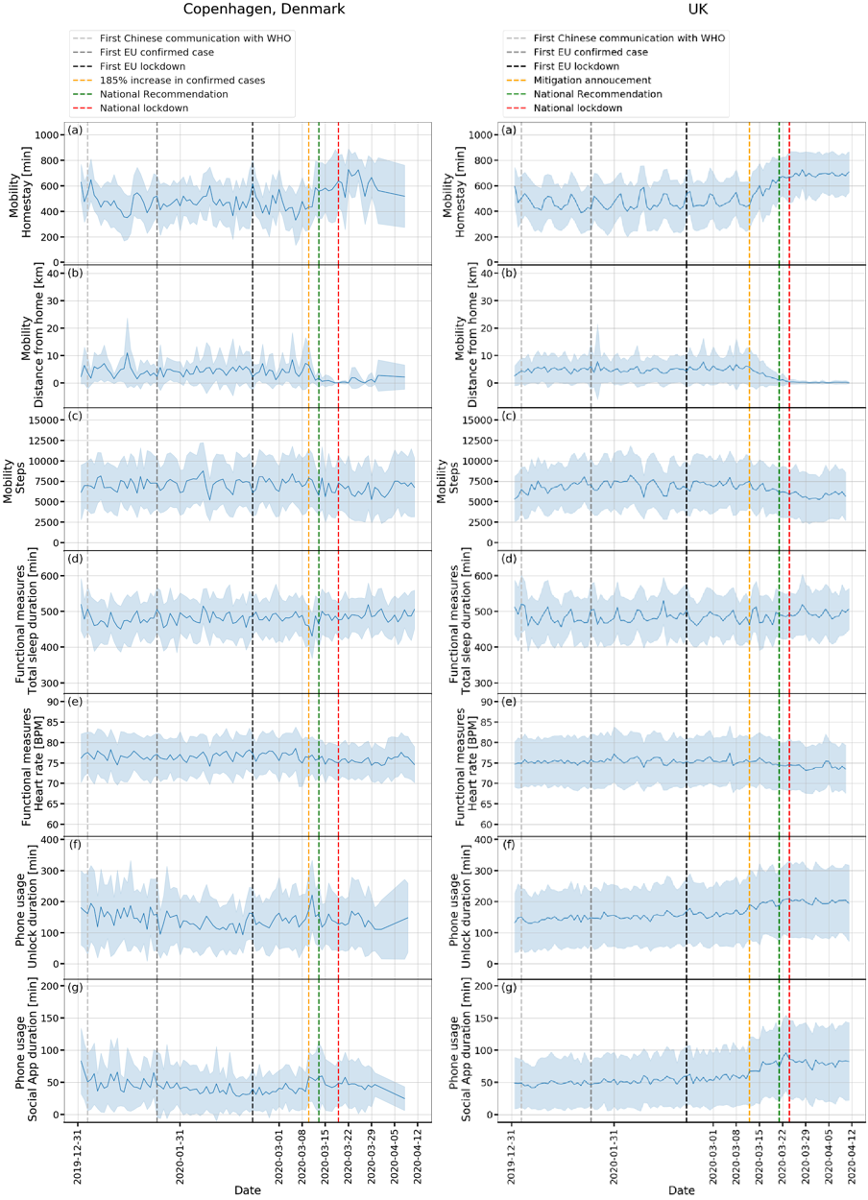
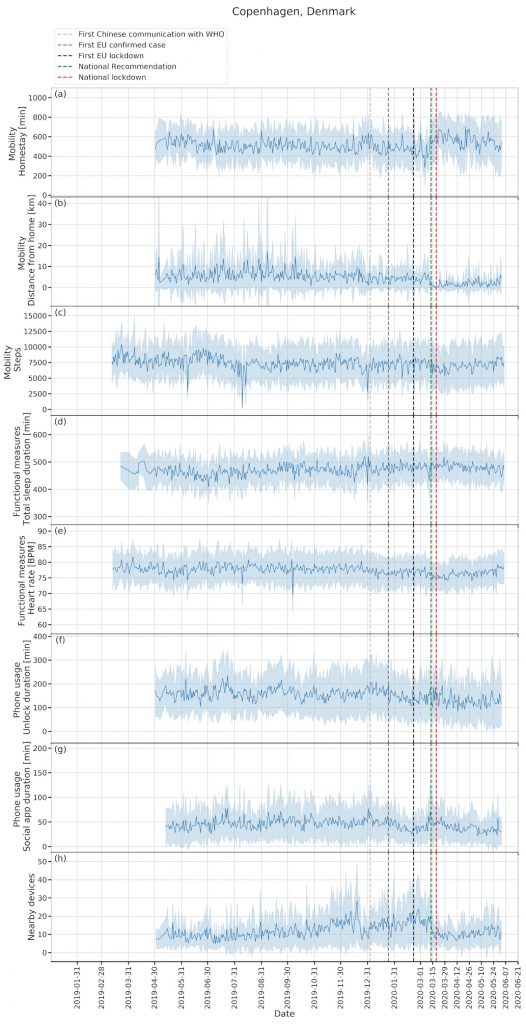
Figure 3. Time series plots for Copenhagen, Denmark (106 participants).
For the most recent updated figures, please visit here.
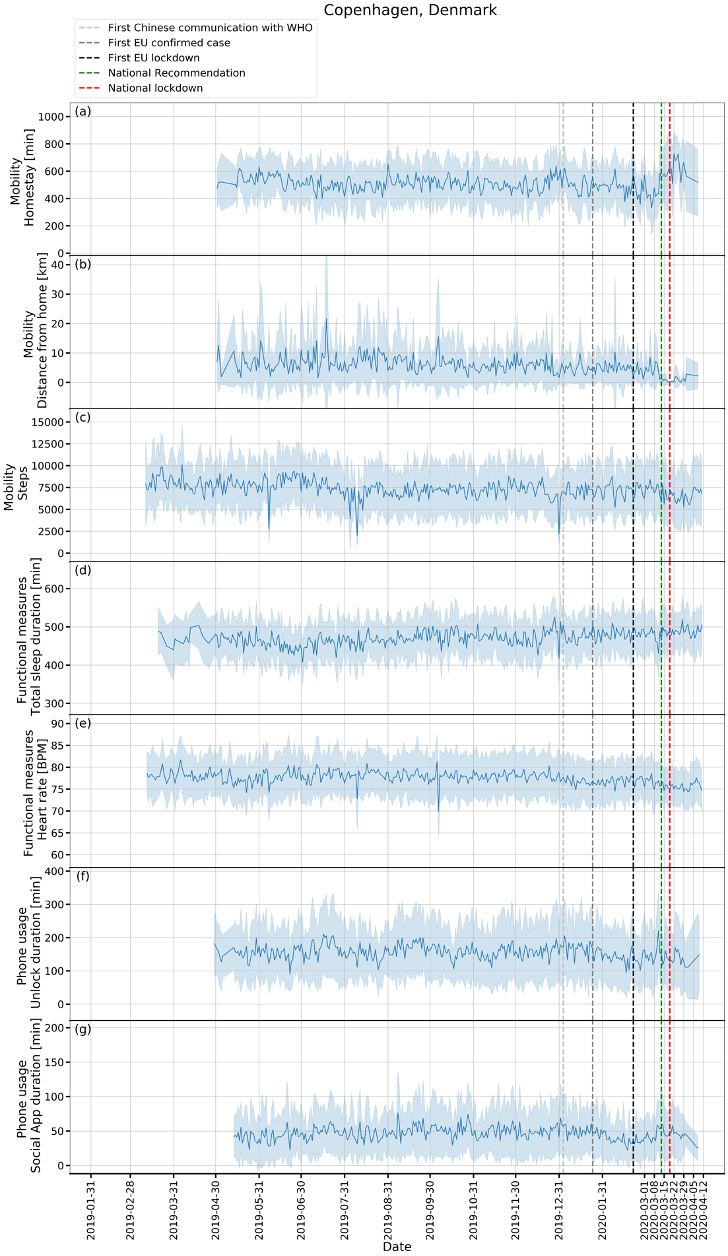
(a): homestay duration, (b): maximum distance from home, (c): Fitbit step count, (d): total sleep duration, (e): heart rate, (f): unlock duration, (g): social app duration. Solid line: mean, shade: mean ± standard deviation.
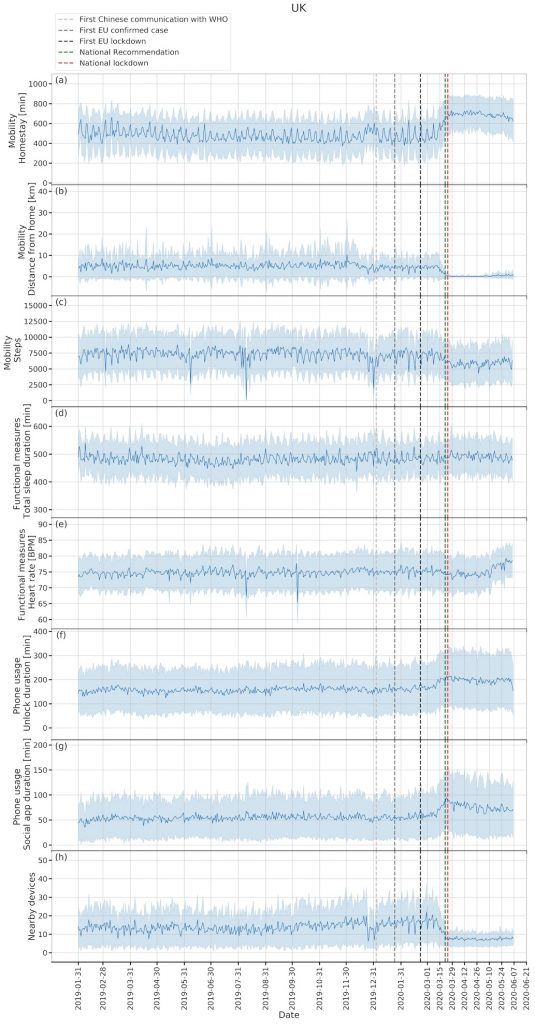
Figure 4. Time series plots for London, the United Kingdom (316 participants).
For the most recent updated figures, please visit here.
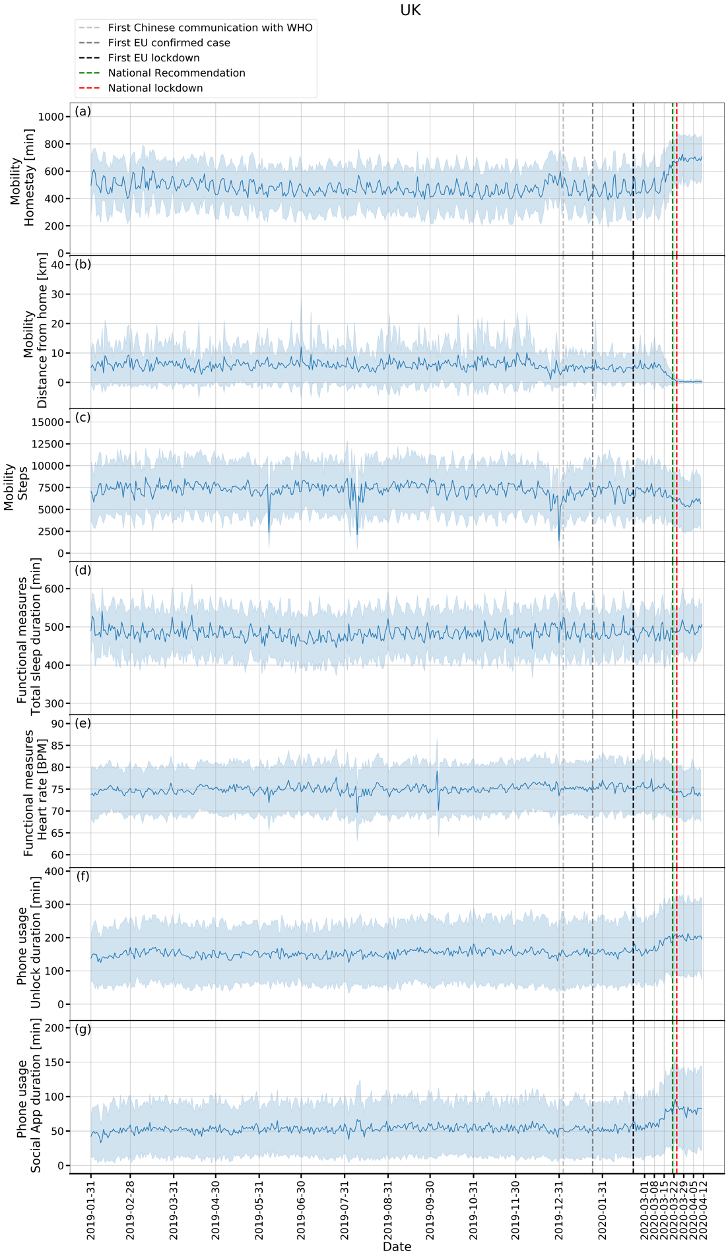
(a): homestay duration, (b): maximum distance from home, (c): Fitbit step count, (d): total sleep duration, (e): heart rate, (f): unlock duration, (g): social app duration. Solid line: mean, shade: mean ± standard deviation.
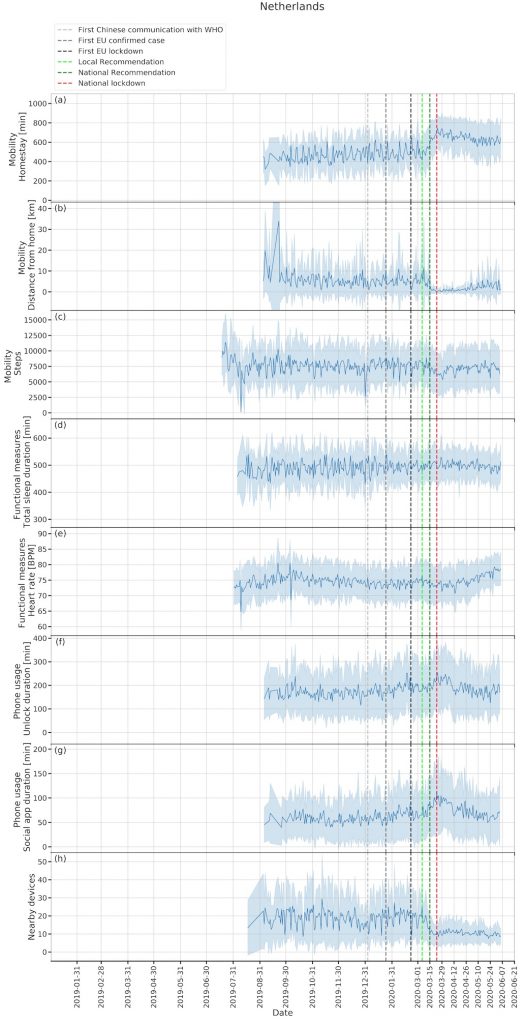
Figure 5. Time series plot for Amsterdam, the Netherlands (103 participants).
For the most recent updated figures, please visit here.
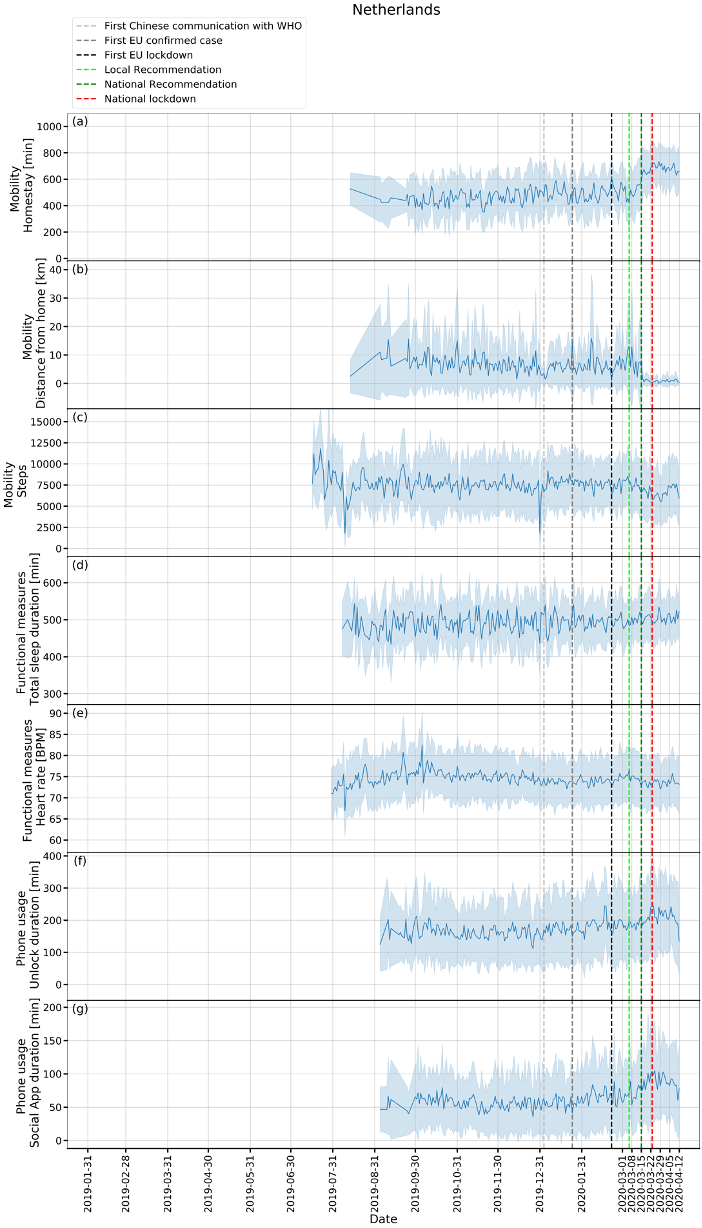
(a): homestay duration, (b): maximum distance from home, (c): Fitbit step count, (d): total sleep duration, (e): heart rate, (f): unlock duration, (g): social app duration. Solid line: mean, shade: mean ± standard deviation.
Figure 6. Boxplots for comparisons among baseline, pre- and post-lockdown phases for different features.
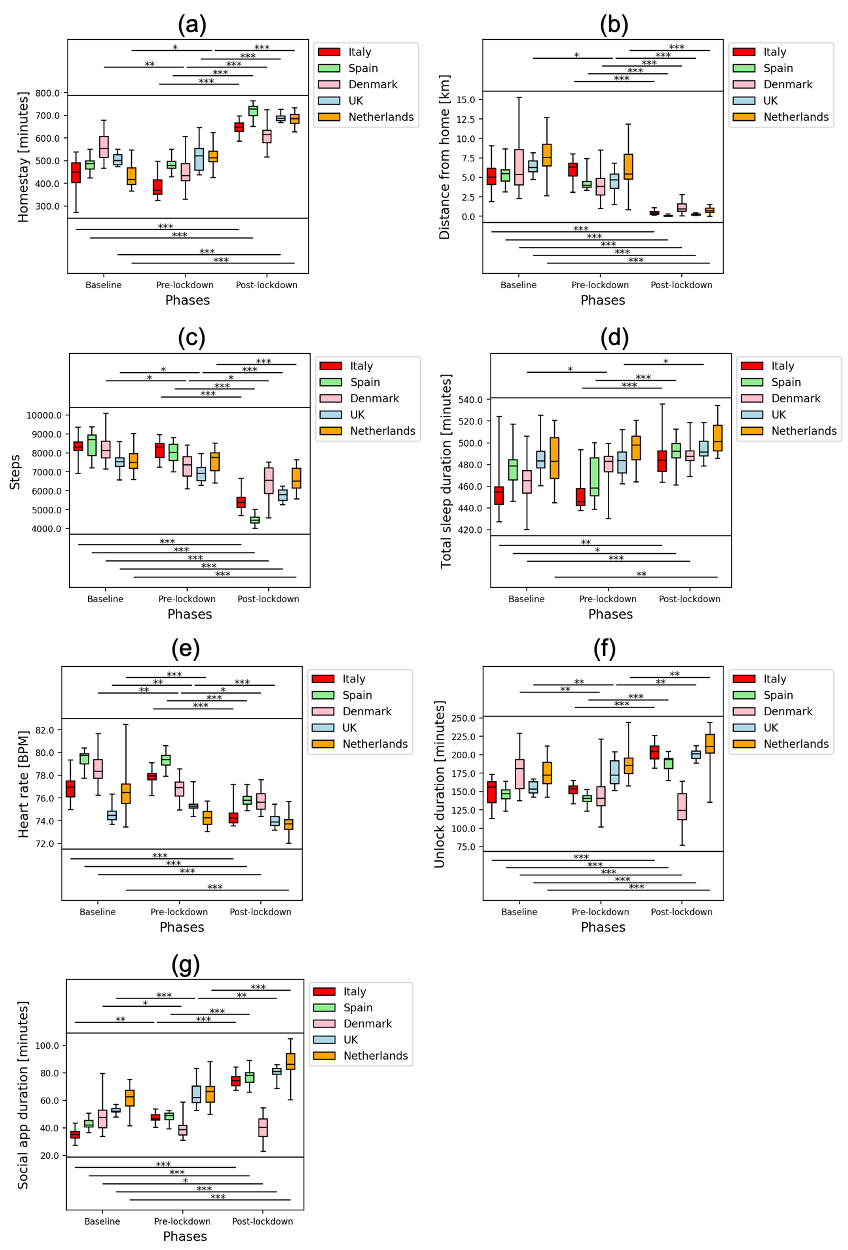
* means p < 0.05, ** means p < 0.01, ** means p < 0.001. (a): homestay duration, (b): maximum distance from home, (c): Fitbit step count, (d): total sleep duration, (e): heart rate, (f): unlock duration, (g): social app duration.
Contributors
SS, AAF, and RJBD contributed to the study design. SS contributed to the data analysis, figures drawing, and manuscript writing. AAF, NC, VAN, GC, MH and RJBD contributed to the critical revision of the manuscript. AAF, YR, ZR, PC, CS, and RJBD contributed to the platform design and implementation. AAF, IMG, AR, VAN, GC, MH, and RJBD contributed to the administrative, technical and clinical support of the study. FM, GDC, LL, ALG, AZ, BWJHP, FL, SS, JMH contributed to data collection.
Data Sharing
The scientific data used in this paper is collected under the project: EU/EFPIA IMI RADAR-CNS (grant agreement No 115902). The data usability and sharing are performed under the agreed guidelines of RADAR-CNS consortium. The anonymised data will be shared upon request subject to RADAR-CNS consortium approval. Pending the aforementioned approval, data sharing will be made in a secure setting, on a per-case-specific manner. Please submit such requests to the corresponding author of the paper. The shared data cannot be used for publication purposes without explicit consent of the RADAR-CNS consortium. The additional related documents are available (e.g. study protocol, statistical analysis plan, informed consent form) upon request.
Declaration of interests
VAN is an employee of Janssen Research & Development LLC and may own equity in the company.
Acknowledgements
This study was supported by National Institute for Health Research (NIHR) Biomedical Research Centre at South London and Maudsley NHS Foundation Trust, King’s College London, and EU/EFPIA IMI Joint Undertaking 2 (RADAR-CNS grant No 115902). This communication reflects the views of the RADAR-CNS consortium, and neither IMI nor the European Union and EFPIA are liable for any use that may be made of the information contained herein. Participant recruitment in Amsterdam, the Netherlands was partially accomplished through Hersenonderzoek.nl, the Dutch online registry that facilitates participant recruitment for neuroscience studies (www.hersenonderzoek.nl). Hersenonderzoek.nl is funded by ZonMw-Memorabel (project no. 73305095003), a project in the context of the Dutch Deltaplan Dementie, Gieskes-Strijbis Foundation, the Alzheimer’s Society in the Netherlands (AlzheimerNederland) and Brain Foundation Netherlands (Hersenstichting). This study has also received support from Health Data Research UK (funded by the UK Medical Research Council), Engineering and Physical Sciences Research Council, Economic and Social ResearchCouncil, Department of Health and Social Care (England), Chief Scientist Office of the Scottish Government Health and Social Care Directorates, Health and Social Care Research and Development Division (Welsh Government), Public Health Agency (Northern Ireland), British Heart Foundation and Wellcome Trust, and The National Institute for Health Research University College London Hospitals Biomedical Research Centre.
References
- Bai Y, Yao L, Wei T, Tian F, Jin DY, Chen L, et al. Presumed Asymptomatic Carrier Transmission of COVID-19. JAMA 2020; 323: 1406–7.
- Xu Z, Shi L, Wang Y, Zhang J, Huang L, Zhang C, et al. Pathological findings of COVID-19 associated with acute respiratory distress syndrome. Lancet Respir Med 2020; 8: 420– 2.
- Liu Y, Gayle AA, Wilder-Smith A, Rocklöv J. The reproductive number of COVID-19 is higher compared to SARS coronavirus. J Travel Med. 2020; published online Feb 13. DOI:10.1093/jtm/taaa021
- Huang C, Wang Y, Li X, Ren L, Zhao J, Hu Y, et al. Clinical features of patients infected with 2019 novel coronavirus in Wuhan, China. Lancet 2020; 395: 497–506.
- Chan JFW, Yuan S, Kok KH, To KKW, Chu H, Yang J, et al. A familial cluster of pneumonia associated with the 2019 novel coronavirus indicating person-to-person transmission: a study of a family cluster. Lancet 2020; 395: 514–23.
- Guan W-J, Ni Z-Y, Hu Y, Liang W-H, Ou C-Q, He J-X, et al. Clinical Characteristics of Coronavirus Disease 2019 in China. N Engl J Med 2020; published online Feb 28. DOI:10.1056/NEJMoa2002032
- Wu Z, McGoogan JM. Characteristics of and Important Lessons From the Coronavirus Disease 2019 (COVID-19) Outbreak in China. JAMA 2020; 323: 1239–42.
- Lau H, Khosrawipour V, Kocbach P, Mikolajczyk A, Schubert J, Bania J, et al. The positive impact of lockdown in Wuhan on containing the COVID-19 outbreak in China. J Travel Med 2020; published online 17 March 2020. DOI: 10.1093/jtm/taaa037
- Lazzerini M, Putoto G. COVID-19 in Italy: momentous decisions and many uncertainties. Lancet Glob Heal 2020; published online March 18. DOI: 10.1016/S2214-109X(20)30110-8
- Pandian PS, Mohanavelu K, Safeer KP, Kotresh TM, Shakunthala DT, Gopal P, et al. Smart Vest: Wearable multi-parameter remote physiological monitoring system. Med Eng Phys 2008; 30: 466–77.
- Cancela J, Pastorino M, Tzallas AT, Tsipouras MG, Rigas G, Arredondo MT, et al. Wearability assessment of a wearable system for Parkinson’s disease remote monitoring based on a body area network of sensors. Sensors (Basel) 2014; 14: 17235–55.
- Paradiso R, Alonso A, Cianflone D, Milsis A, Vavouras T, Malliopoulos C. Remote health monitoring with wearable non-invasive mobile system: The HealthWear project. In: Conf Proc IEEE Eng Med Biol Soc. 2008. p. 1699–702.
- Ranjan Y, Rashid Z, Stewart C, Conde P, Begale M, Verbeeck D, et al. RADAR-base: Open source mobile health platform for collecting, monitoring, and analyzing data using sensors, wearables, and mobile devices. JMIR Mhealth Uhealth 2019; 7: e11734.
- Stewart CL, Rashid Z, Ranjan Y, Sun S, Dobson RJB, Folarin AA. RADAR-base: Major depressive disorder and epilepsy case studies. In: UbiComp/ISWC 2018. 2018. p. 1735–43.
- Matcham F, Barattieri di San Pietro C, Bulgari V, de Girolamo G, Dobson R, Eriksson H, RADAR-CNS consortium. Remote assessment of disease and relapse in major depressive disorder (RADAR-MDD): a multi-centre prospective cohort study protocol. BMC Psychiatry 2019; 19: 72
- Ester M, Kriegel H-P, Sander J, Xu X. A Density-Based Algorithm for Discovering Clusters in Large Spatial Databases with Noise. In: Proc 2nd Int Conf Knowledge Discovery and Data Mining (KDD’96). 1996. p.226–31.
- Hale T, Webster S, Petherick A, Phillips T, and Kira K. Oxford COVID-19 Government Response Tracker, Blavatnik School of Government. Data use policy: Creative Commons Attribution CC BY standard 2020. https://www.bsg.ox.ac.uk/research/research-projects/coronavirus-government-response-tracker (accessed April 16, 2020)
- Ostertagová E, Ostertag O, Kováč J. Methodology and application of the Kruskal-Wallis Test. Appl Mech Mater 2014; 611: 115–20.
- Dinno A. Nonparametric pairwise multiple comparisons in independent groups using Dunn’s Test. Stata J 2015; 15: 292–300.
- https://www.gstatic.com/COVID19/mobility/2020-04-11_GB_Mobility_Report_en.pdf (accessed April 16, 2020)
- https://www.gstatic.com/COVID19/mobility/2020-04-11_ES_Mobility_Report_en.pdf (accessed April 16, 2020)
- https://www.gstatic.com/COVID19/mobility/2020-04-11_DK_Mobility_Report_en.pdf (accessed April 16, 2020)
- https://www.gstatic.com/COVID19/mobility/2020-04-11_IT_Mobility_Report_en.pdf (accessed April 16, 2020)
- https://www.gstatic.com/COVID19/mobility/2020-04-11_NL_Mobility_Report_en.pdf (accessed April 16, 2020)
- Radin JM, Wineinger NE, Topol EJ, Steinhubl SR. Harnessing wearable device data to improve state-level real-time surveillance of influenza-like illness in the USA: a population-based study. Lancet Digit Heal 2020; 2: e85–93.
Latest Figures
7 June 2020
Figure 1 Annex. Time series plots for Milan, Italy (208 participants). Zoom-in (for 2020) – second plots.
![]()
(a): homestay duration, (b): maximum distance from home, (c): Fitbit step count, (d): total sleep duration, (e): heart rate, (f): unlock duration, (g): social app duration. Solid line: mean, shade: mean ± standard deviation.
Figure 2 Annex. Time series plots for Spain (329 participants). Zoom-in (for 2020) – second plots.
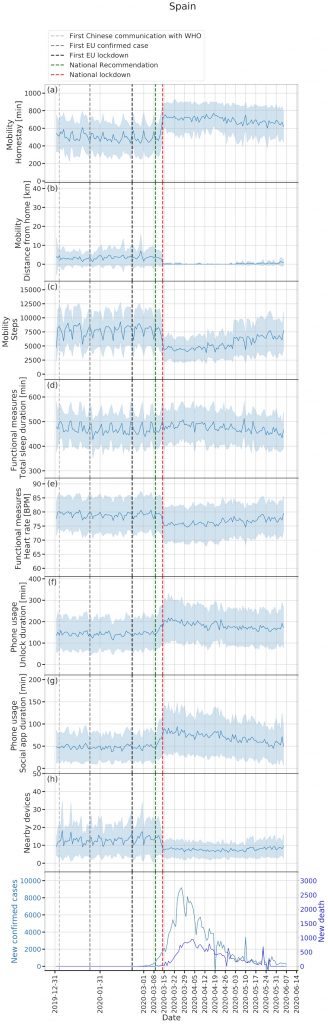
(a): homestay duration, (b): maximum distance from home, (c): Fitbit step count, (d): total sleep duration, (e): heart rate, (f): unlock duration, (g): social app duration. Solid line: mean, shade: mean ± standard deviation.
Figure 3 Annex. Time series plots for Copenhagen, Denmark (106 participants). Zoom-in (for 2020) – second plots.
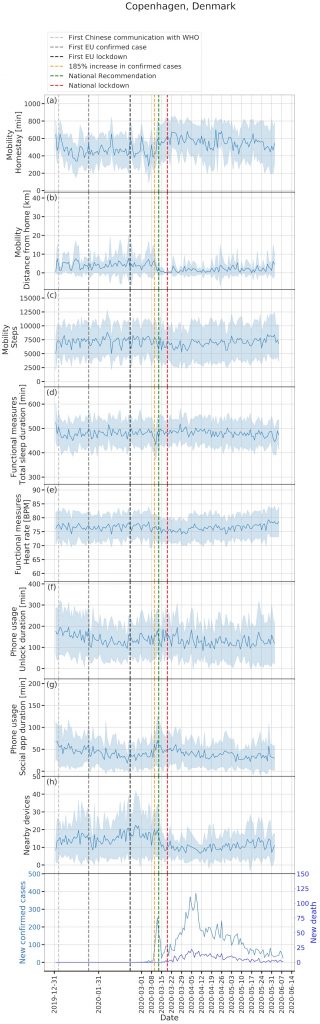
(a): homestay duration, (b): maximum distance from home, (c): Fitbit step count, (d): total sleep duration, (e): heart rate, (f): unlock duration, (g): social app duration. Solid line: mean, shade: mean ± standard deviation.
Figure 4 Annex. Time series plots for London, the United Kingdom (316 participants). Zoom-in (for 2020) – second plots.
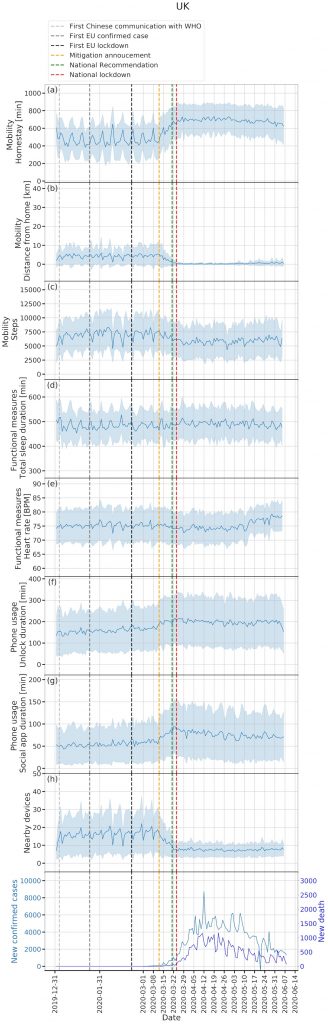
(a): homestay duration, (b): maximum distance from home, (c): Fitbit step count, (d): total sleep duration, (e): heart rate, (f): unlock duration, (g): social app duration. Solid line: mean, shade: mean ± standard deviation.
Figure 5 Annex. Time series plot for Amsterdam, the Netherlands (103 participants). Zoom-in (for 2020) – second plots.
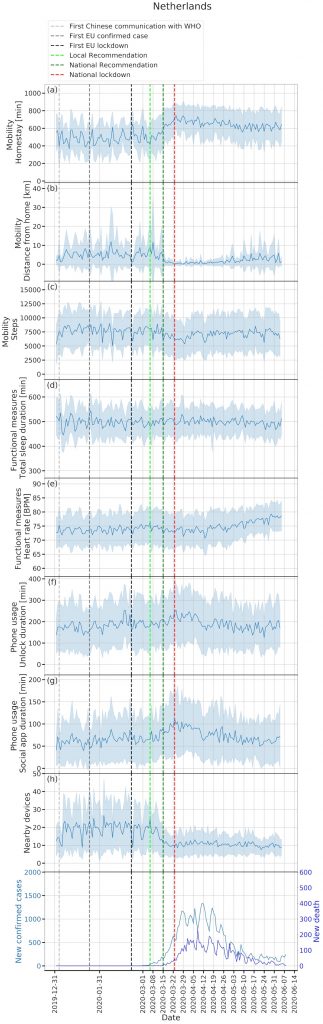
(a): homestay duration, (b): maximum distance from home, (c): Fitbit step count, (d): total sleep duration, (e): heart rate, (f): unlock duration, (g): social app duration. Solid line: mean, shade: mean ± standard deviation.